ArcGIS Instant Apps provides the following collection of app templates to create purpose-driven apps for interacting with maps and data. Each app template has a specific purpose, such as viewing a map or scene, comparing content, getting directions, exploring a gallery of content, and finding something nearby. You can create an app using the template defaults (for most apps), or you can start with a template and modify its configurable settings for a custom app tailored to your audience, data, and goals.
Tip:
If you need help choosing an app, use the Suggestions panel on the Create tab of the home page to filter the templates gallery based on answers to questions about your goals, the app audience, and the content you're using. You can also compare app capabilities.
| Template name | Description |
|---|---|
 | Interact with scenes. Provide a dual view of an area of interest with optional tools for navigating the scene, including slides and search. |
 | Provide an app for users to page through a layer's features and review image, video, and PDF attachments with the option to edit attribute data. This is a good choice for presenting data and images collected with ArcGIS apps such as ArcGIS Field Maps and ArcGIS Survey123. |
 | Display a map or scene with standard options such as a legend and bookmarks. |
 | Build a gallery of maps, scenes, apps, and layers, and provide an interactive experience to filter the content in the gallery. You can categorize group content into themes or topics and expose them to users as filtering options. |
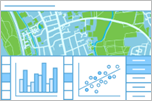 | Display bar charts, line charts, pie charts, histograms, and scatter plots to complement a map. Up to three charts can be viewed side by side or stacked, but you can access and view all the charts that are authored in the map. |
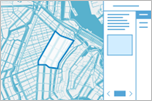 | Display a list of locations in a map or scene ranked by values for a specified field. Provide a summary for the ranked locations and information about the feature order. Users can pin feature information to compare and contrast with other features in the ranked list. |
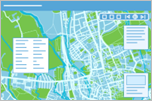 | Create a linear, interactive presentation by authoring a collection of slides to show different views of a map or scene. For each slide, you can change layer visibility and the basemap, include a pop-up for a specific feature, apply a layer filter, and provide a title and notes. If applicable, you can import bookmarks from the map to create slides. |
 | Visualize and explore imagery through time and space. |
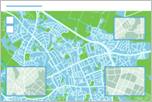 | Display noncontiguous geographic locations within a single app layout so users can view and interact with data from a layer in multiple locations at once. |
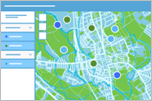 | Create a focused view of a feature layer in the map by clicking the desired categories or ranges defined in the legend. This allows users to explore the map holistically or to focus on the categories that are most relevant to them. |
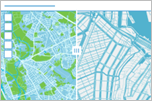 | Display an interactive map with basic tools and a set of options for limiting map navigation. Optionally, include a swipe tool to compare layers or an interactive slider to animate time-enabled data. This app is designed to fit into small spaces embedded in a web page or as a stand-alone app. |
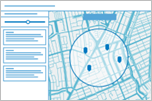 | Help people find sites of interest close to an address. This app is useful to help people find focused types of locations (such as schools) within a search distance of an address or place they specify. Optionally, they can edit distance values to adjust the search radius and get directions to locations they select. |
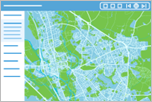 | Present a series of maps, apps, and other content, such as images, PDFs, and embedded web pages. This is a good choice to create a simple interactive display of many maps and apps that share a topic. |
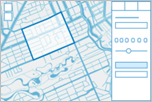 | Use search and sketch tools in a map to create lists of features that can be exported as PDF and CSV format. For example, agencies can streamline the process of generating public notices by identifying a collection of affected properties based on proximity to a location or an area drawn on the map, and creating formatted mailing labels to notify property owners or occupants. |
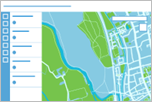 | Present a map with minimal or many tools and an optional side panel for more information, such as a legend, a description, pop-ups, and a layer list with the option to open an attribute table, and tools to edit, filter, and interact with data. |
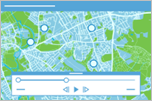 | Display historical, live, or future data using any time interval. Users can play or move a time slider to animate data based on numeric values or changes over time to see how the data evolves. |
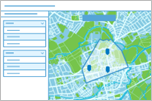 | Facilitate finding which zone or district intersects a specific location or address. With this app, users can learn more about a location and features of interest in the surrounding area. |
Template capabilities
To compare app capabilities across the templates, refer to the tables grouped by the following configuration categories.
Note:
Some settings are implemented differently depending on the purpose and layout of the app template. These exceptions are indicated in the tables by an asterisk or footnote.
For an alphabetical table that compares the configurable capabilities, see the app tools matrix (PDF).